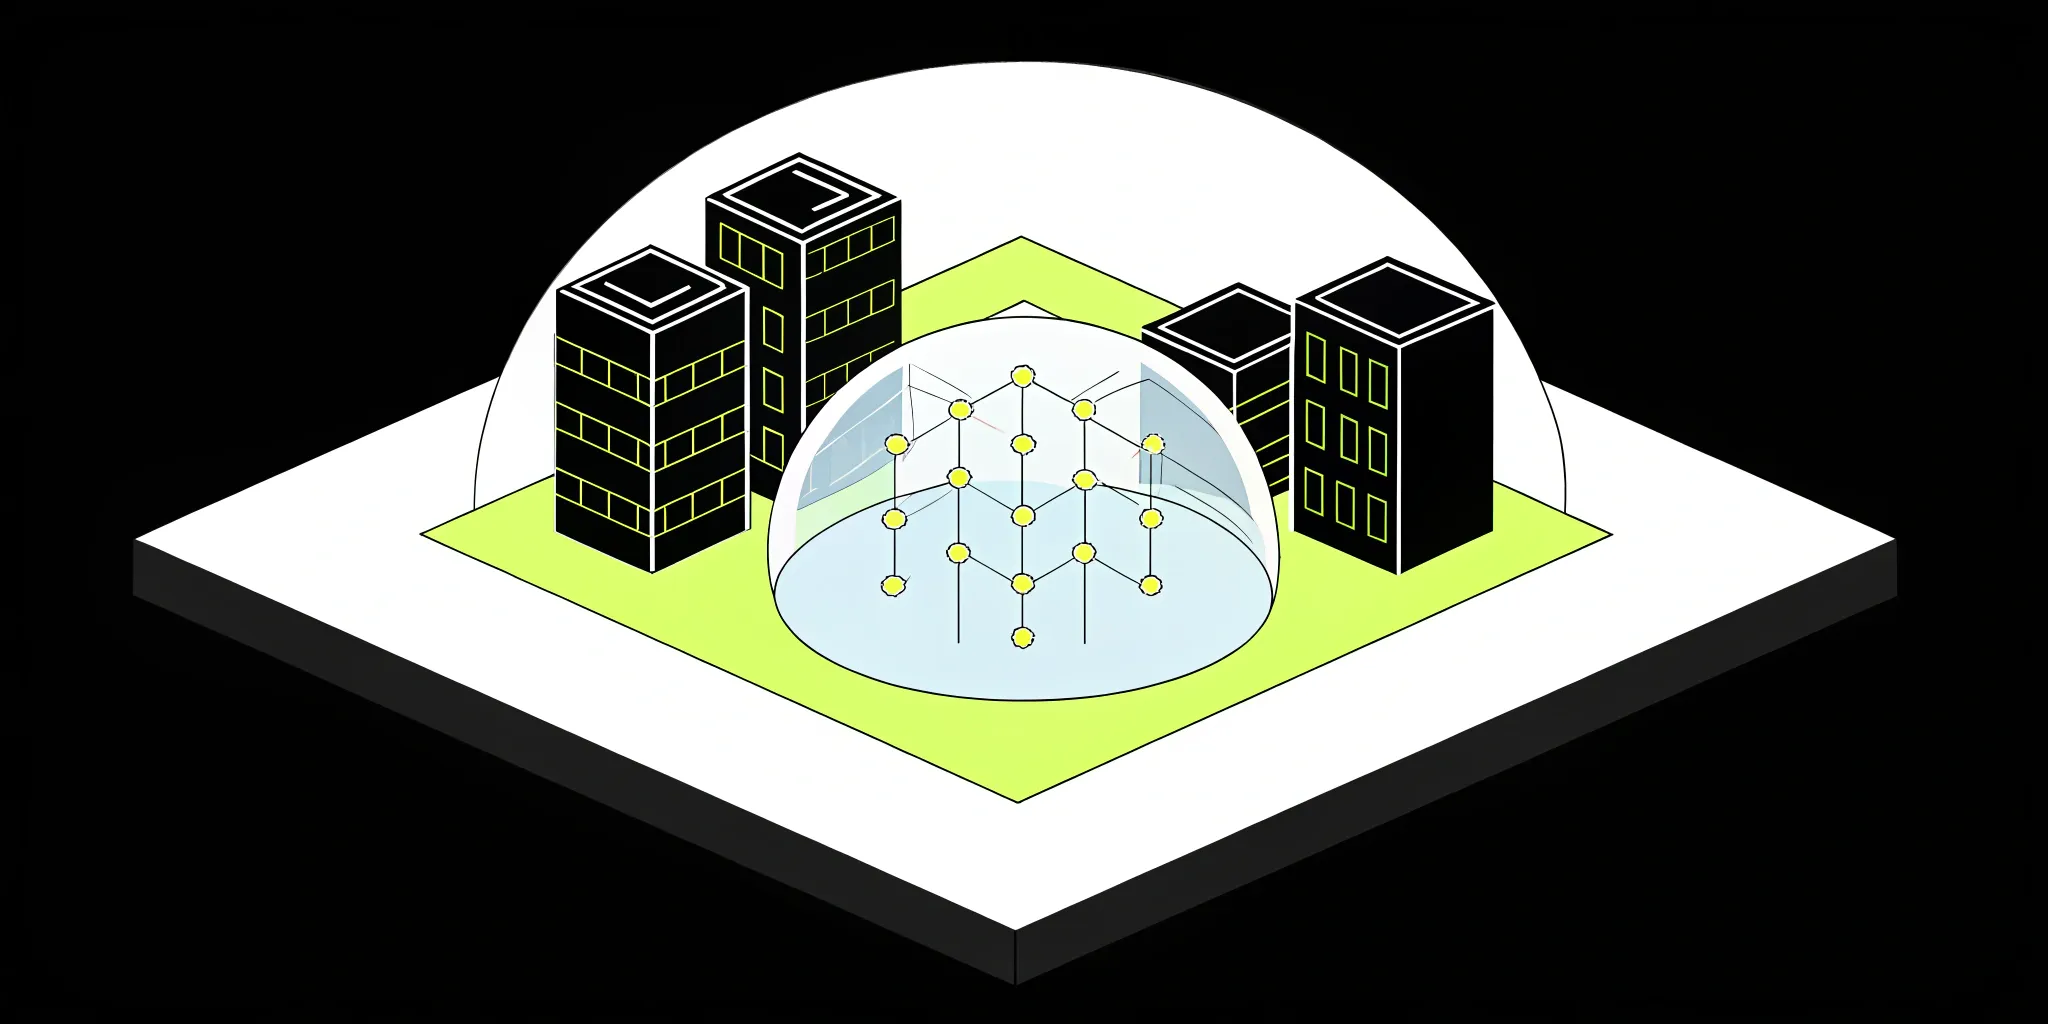
At its core, understanding observability is about being able to ask any question about your software’s internal state and get a clear, data-backed answer. It’s a shift from only watching for problems you already know about to having the power to investigate issues you never saw coming. This is especially critical for modern, distributed systems where a single user request can travel through dozens of different services. By collecting and connecting three key types of data—logs, metrics, and traces—observability gives you a complete picture of your system’s health, allowing you to solve problems with confidence.
Key takeaways
- Combine logs, metrics, and traces for a complete view: True observability comes from using logs (what happened), metrics (system health), and traces (the request's journey) together. This combination gives you the full context to understand any issue, not just the ones you planned for.
- Follow the data to find the root cause faster: Use the three pillars as a step-by-step guide for troubleshooting. A metric can alert you to a problem, a trace pinpoints the failing service, and logs provide the specific error details to show you exactly why it happened.
- Shift from reactive fixes to proactive improvements: Observability isn't just for when things break. Use the data to find hidden bottlenecks and performance issues before they impact users, leading to a more stable application and a better customer experience.
What is observability in software systems?
Think of observability as the ability to truly understand what’s happening inside your software systems just by looking at the data they produce. It’s about moving beyond pre-set dashboards and asking any question you want about your system’s behavior, even questions you didn’t think of when you first built it. This capability allows your team to get a clear picture of your application's internal state at any moment. It’s the difference between knowing something is broken and knowing exactly why, where, and how it broke.
This level of insight is especially critical for modern applications. Many systems today are built using microservices, i.e. lots of small, independent services that work together. While this approach is great for scaling, it can make troubleshooting a nightmare. When a problem occurs, it can be incredibly difficult to pinpoint the source across dozens of interconnected parts. As experts at IOD note, this complexity makes it hard to fix problems when they happen. Observability gives you the tools to see how all these pieces are interacting, so you can find and resolve issues before they affect your users.
To achieve this, observability relies on collecting and analyzing three main types of data: logs, metrics, and traces. Together, this "telemetry data" provides a rich, detailed story of your system's health and performance. By gathering this information, teams can solve problems faster and optimize systems more effectively. Ultimately, having a strong observability practice helps you build more reliable software and deliver a better experience for your customers, which directly impacts the organization’s bottom line.
Many systems today are built using microservices, i.e. lots of small, independent services that work together. While this approach is great for scaling, it can make troubleshooting a nightmare. When a problem occurs, it can be incredibly difficult to pinpoint the source across dozens of interconnected parts.
Meet the three pillars of observability
To truly understand what’s happening inside your software, you need to look at it from a few different angles. This is where the three pillars of observability come into play. Think of them as three distinct types of data—logs, metrics, and traces—that work together to give you a complete and detailed picture of your system's health. Each one tells a different part of the story. Logs provide a detailed, event-by-event record. Metrics offer a high-level view of performance and health. And traces map out the entire journey of a single request as it moves through your system.
Relying on just one of these is like trying to solve a puzzle with missing pieces. But when you combine them, you can move from simply reacting to known problems to proactively understanding your entire system. This allows you to ask new questions and find answers you didn't even know you were looking for, which is essential for managing complex AI applications. A solid observability strategy built on these pillars helps ensure your AI projects are not just innovative but also stable and efficient.
1. Logs: See a complete record of events
Think of logs as the detailed, historical diaries of your system. They are timestamped records of every event that occurs, often captured as lines of text. When something goes wrong, logs are often the first place you’ll look to find out the "who, what, when, and how" behind an error. They provide the ground-level context you need to debug issues effectively. Beyond troubleshooting, logs can also help you spot unusual patterns that might indicate a security issue or even provide insights into customer behavior. By analyzing log data, you can get a clear, chronological account of your system's activity.
2. Metrics: Measure your system's health
Metrics are the vital signs of your system. They are numerical measurements, like CPU usage, memory consumption, or error rates, tracked over time. These numbers give you a quick, at-a-glance understanding of your system’s overall health. Are things running smoothly, or is a key resource about to be maxed out? Metrics will tell you. Because they are just numbers, they are generally efficient to store and process, making them perfect for building dashboards and setting up alerts. An alert can automatically notify you when a metric crosses a certain threshold, so you can address potential problems before they impact users.
3. Traces: Follow a request from start to finish
If logs are a diary and metrics are vital signs, then traces are the GPS map for a single request. A trace follows one user's action from the moment they click a button all the way through the various services and components in your system until a response is delivered. This is incredibly valuable in modern, distributed systems where a single request might touch dozens of microservices. If a user reports that the app is slow, a trace can pinpoint exactly which step in the process is causing the delay. They show you not just what happened, but how all the different parts of your system worked together to make it happen.
How logs, metrics, and traces work together
While each of the three pillars of observability is useful on its own, their real power is unlocked when you use them together. Think of them as three different camera angles on the same event. A log gives you a close-up, a metric provides a wide shot, and a trace follows the action from start to finish. By combining these perspectives, you get a complete and contextualized view of what’s happening inside your software systems.
This synergy is what separates modern observability from traditional monitoring. Instead of just knowing that something is wrong, you can quickly understand where it’s happening, what its impact is, and why it occurred. This allows your team to connect the dots between different pieces of data, turning a confusing issue into a clear, actionable story. When your tools allow you to pivot seamlessly between these data types, you can diagnose and resolve problems with greater speed and precision.
Get the full story of your system's health
To understand how the three pillars create a complete picture, imagine you’re a detective solving a case. A metric is the first clue that something is wrong (e.g., an alert fires because your application's error rate has suddenly spiked). This tells you that a problem exists, but not much else.
That’s when you turn to traces. A trace acts as a map of the crime scene, showing you the exact path a failing request took through your distributed system. It pinpoints which service or component is the source of the error. Now you know where the problem is. Finally, you examine the logs from that specific service. The logs are your detailed witness statements, providing the granular, line-by-line context and error messages needed to understand why the failure happened. By combining these different types of telemetry data, you get the full story.
Use them together to solve problems faster
When your team can move fluidly from a high-level metric to a specific trace and then to a detailed log, the entire troubleshooting process accelerates. You’re no longer hunting for clues in the dark or sifting through mountains of unrelated information. Instead, you have a clear, data-driven path that leads you directly to the source of the issue. This integrated approach helps you find out why a system failed and fix problems much more quickly.
This isn't just about reacting to failures faster. Consistently using logs, metrics, and traces together helps you build a deeper understanding of your system’s behavior and potential failure modes over time. By implementing observability across your environment, you can effectively trace issues to their root causes and build more resilient, reliable, and performant software for your users.
When your software misbehaves, "I don't know" is the last thing you or your customers want to hear. But in today's complex, distributed systems (especially those running AI models), pinpointing the root cause of an issue can feel like searching for a needle in a haystack.
Why observability is essential for your software
When your software misbehaves, "I don't know" is the last thing you or your customers want to hear. But in today's complex, distributed systems (especially those running AI models) pinpointing the root cause of an issue can feel like searching for a needle in a haystack. This is where observability comes in. It’s not just another word for monitoring; it’s a fundamental shift in how you understand and interact with your systems.
Observability gives you the power to ask any question about your software and get a clear, data-backed answer. Instead of just knowing that something is wrong (like a server is down), you can understand why it’s wrong (like a specific microservice is creating a bottleneck that’s causing a cascade of failures). This capability allows your team to move from a reactive state of constantly fighting fires to a proactive one of building more resilient, efficient, and reliable software. It’s about gaining deep insights that help you troubleshoot faster, optimize performance, and ultimately, build a better product for your users.
Troubleshoot issues more efficiently
Instead of spending hours sifting through endless logs or guessing at the source of a problem, observability gives your team a clear path to the answer. When an issue arises, you can use traces to follow the exact journey of a request as it moves through your entire system. This allows you to see precisely where an error occurred or where a slowdown is happening.
By implementing observability, you can better understand your system's failure modes and trace problems directly to their root causes. This turns troubleshooting from a high-stress, speculative exercise into a methodical, evidence-based process. Your team can resolve incidents faster, reduce downtime, and spend less time diagnosing problems and more time building features.
Pinpoint opportunities to improve performance
Observability isn't just for fixing things that are broken; it's also a powerful tool for making good systems even better. The data you collect provides a detailed map of your system's performance, highlighting inefficiencies and bottlenecks you might not have known existed. Are certain database queries consistently slow? Is one microservice taking longer than others to respond under load? Observability brings these issues to the surface.
These new insights help your teams run more efficiently and make targeted improvements that have a real impact. By proactively optimizing your systems, you can improve speed and reliability, which often translates to lower operational costs and a much better experience for your customers.
Create a better user experience
Ultimately, the performance of your software directly impacts your users. Slow load times, unexpected errors, and system instability lead to frustration and can drive customers away. Observability helps you see your system through your users' eyes, allowing you to identify and fix the issues that are hurting their experience the most.
With effective trace data analysis, you can understand the complete behavior of your distributed systems and how it affects the end user. By finding and resolving performance issues before they become widespread problems, you build trust and loyalty. A well-observed system is a more stable and predictable one, which means you’re not just shipping code—you’re delivering a consistently positive experience.
The biggest benefits of observability
Adopting observability isn't just about adding another tool to your stack; it's about fundamentally changing how you understand and manage your systems. When you can see exactly what’s happening inside your applications, you move from reacting to problems to proactively improving your software. This shift has a direct impact on your team's efficiency and your customers' happiness. For complex environments like AI and machine learning platforms, these benefits are even more critical. With a clear view of your entire system, you can ensure your AI initiatives are built on a reliable and performant foundation. The true value of observability and tracing comes from turning raw data into clear, actionable insights that help you build better products. It’s about empowering your teams to work smarter, not harder, by giving them the context they need to make confident decisions and keep your systems running smoothly.
Adopting observability isn't just about adding another tool to your stack; it's about fundamentally changing how you understand and manage your systems. When you can see exactly what’s happening inside your applications, you move from reacting to problems to proactively improving your software.
Resolve issues faster
When an issue pops up, the last thing you want is a frantic scramble for answers. Observability brings all the clues together in one place, so your team can stop guessing and start solving. Instead of digging through separate tools for logs, metrics, and traces, they can see the entire lifecycle of a request and immediately spot where things went wrong. This comprehensive view delivers the deep insights that help teams run more efficiently and solve problems quicker. By connecting the dots between a user-facing error and the specific line of code or service that caused it, you can drastically reduce your mean time to resolution (MTTR) and get your systems back on track in record time.
Find problems before your users do
The best user experience is one where problems never happen in the first place. Observability helps you get ahead of issues by revealing subtle signs of trouble before they escalate into full-blown outages. By monitoring trends and spotting anomalies in your metrics and traces, you can identify potential problems, like a slow memory leak or increasing latency in a critical service. A robust observability platform allows your team to predict and address these issues before they ever impact a customer. This proactive approach not only improves system reliability but also builds trust with your users, who can depend on your service to be available when they need it.
Make smarter, data-backed decisions
Great observability practices do more than just help you fix what's broken; they provide the data you need to build for the future. With rich, contextual information at your fingertips, your teams can move beyond simple monitoring and flexibly investigate the root causes of performance bottlenecks. This data-driven approach allows you to make smarter decisions about everything from infrastructure spending to feature development. You can pinpoint exactly where performance optimizations will have the most impact, understand how users are interacting with new features, and confidently allocate resources to the areas that matter most. It’s about using your system’s data to inform your business strategy.
Common challenges to look out for
As powerful as observability is, getting it right isn't always a walk in the park. When you start pulling back the curtain on your systems, you’ll find a few common hurdles that can trip up even the most prepared teams. The sheer amount of data you collect can quickly become overwhelming, your collection of monitoring tools can get tangled and complex, and the constant stream of alerts can start to sound like white noise.
But don't let that discourage you. Thinking about these challenges ahead of time is the best way to prepare for them. With a solid strategy and the right platform, you can sidestep these issues and get all the benefits of a truly observable system without the headaches. The key is to be intentional about how you collect data, integrate your tools, and manage your alerts. Let’s break down what to watch for and how you can stay ahead of the curve.
How to handle large volumes of data
Modern systems generate a staggering amount of information. Observability tools are designed to collect, process, and correlate telemetry data—metrics, logs, and traces—from every corner of your system to build a complete picture. While this is great for visibility, it can lead to a data deluge. Storing and analyzing all of this information can be expensive and complex. The solution isn’t to capture less data, but to be smarter about it. You can use techniques like intelligent sampling for traces and set clear data retention policies for logs so you’re only keeping what’s truly valuable for a specific period.
Simplify your tool integrations
It’s easy to end up with a separate tool for everything: one for logs, another for metrics, and a third for traces. This "tool sprawl" creates data silos and forces your team to jump between different interfaces to connect the dots, which slows down troubleshooting. Instead, many teams are now adopting platforms that bring all three pillars of observability together in one place. Having a single, unified solution gives you a cohesive view of your system’s health, making it much easier to see how different events and performance issues are related. It streamlines your workflow and gives everyone a single source of truth to work from.
Cut through the noise and reduce alert fatigue
When you first set up monitoring, it’s tempting to create an alert for every little thing. But this can backfire. As the experts at Sematext point out, complex systems can create so many alerts that your team eventually gets tired of them. This is known as alert fatigue, and it’s a real problem. When engineers are constantly bombarded with low-priority notifications, they can start to tune them out and might miss the one that signals a critical failure. The fix is to create fewer, more intelligent alerts. Focus on triggers that directly impact user experience or key business outcomes, and use tools that can group related alerts to give you context, not just noise.
IN DEPTH: Observability, powered by Cake
How to implement observability the right way
Putting observability into practice isn't about flipping a switch. It's a strategic shift in how you approach your systems. When you get it right, you move from reacting to problems to proactively improving your software. It’s about building a culture of curiosity where your teams have the data they need to ask smart questions and get clear answers. This approach helps you build more resilient, efficient systems that drive real business results. Let's walk through the key steps to get you started on the right foot.
Choose the right tools and platforms
Picking the right tools is the first step, and it's a big one. You'll find a lot of options out there, from individual tools that handle one specific task to comprehensive observability platforms that bundle everything together. A platform can give you a single, unified view of your data, which makes connecting the dots between logs, metrics, and traces much easier.
When you're evaluating your options, the most important thing is to make sure the tool or platform supports the essential data types you need for your specific applications. Don't just go for the one with the most features; focus on what will give you the clearest insights into your system's health. A good observability tool should feel like a natural extension of your team, helping you collect, analyze, and visualize data without adding unnecessary complexity.
Set clear goals for monitoring
Before you start collecting terabytes of data, take a step back and ask: what are we trying to achieve? Without clear goals, you'll just be gathering data for the sake of it. Your goals should be tied directly to business outcomes. Are you trying to reduce downtime, improve application performance, or ship features faster?
By setting clear objectives, you can focus your efforts on what matters most. For example, you can define specific Service Level Objectives (SLOs) around latency or error rates. This helps you understand your system's failure modes and trace issues back to their root cause. Ultimately, observability delivers insights that help your teams work more efficiently and solve problems faster, which has a direct impact on your bottom line.
Instrument and improve your systems continuously
Instrumentation is how you get the raw data—the logs, metrics, and traces—out of your applications. It involves adding code to your services to emit this telemetry data. While it might sound like a lot of upfront work, modern tools and open standards like OpenTelemetry have made this process much more straightforward.
The key is to see instrumentation not as a one-time project, but as an ongoing practice. As your systems evolve, your instrumentation needs to evolve with them. Continuously analyzing your trace data is essential for understanding how your distributed systems are behaving. This creates a powerful feedback loop: you instrument your code, analyze the data, identify areas for improvement, and then refine your instrumentation to get even deeper insights. This cycle helps you build more resilient systems and consistently optimize performance.
Observability vs. monitoring: What's the difference?
It’s easy to see monitoring and observability as the same thing, but they represent two different approaches to understanding your system’s health. The simplest way to think about it is that monitoring tells you if a system is working, while observability helps you understand why something isn't working.
Monitoring is the more traditional practice. It involves collecting a predefined set of metrics or logs to watch for known failure conditions. You decide ahead of time what to track (e.g., CPU usage, memory, or application error rates) and set up alerts for when those metrics cross a certain threshold. Monitoring is great for answering questions you already know to ask, like, “Is the server down?” or “Is the database responding slowly?” It’s a proactive way to keep an eye on the known-unknowns.
Observability, on the other hand, is a property of a system that allows you to ask new questions without needing to ship new code. It’s essential for modern, complex architectures like microservices and distributed AI platforms, where you can’t possibly predict every single way things might go wrong. Instead of just collecting data on predefined problems, an observable system provides rich, contextual data through logs, metrics, and traces. This allows your team to explore issues, find the root cause of unexpected problems, and truly understand what’s happening across all these environments. Observability is built to handle the unknown-unknowns—the problems you never saw coming.
Ultimately, you don’t have to choose one over the other. Monitoring is an action you take, while observability is a quality you build into your systems. A highly observable system makes your monitoring far more powerful and effective.
What's next for observability and tracing?
Observability isn't a static practice; it's constantly evolving to keep up with the complexity of modern software. As we look ahead, the field is moving toward smarter, more integrated, and proactive solutions that help teams stay ahead of issues. One of the biggest shifts is the growing role of artificial intelligence. The future of observability will lean heavily on automation and AI-driven insights, allowing systems to automatically surface anomalies and predict potential problems before they ever affect a user. Instead of just collecting data, tools will increasingly interpret it for you, pointing you directly to the root cause.
This move toward intelligence is happening alongside a push for unification. The days of juggling separate tools for logs, metrics, and traces are numbered. The trend is toward integrated platforms that bring all your telemetry data together in one place. As more organizations adopt distributed, cloud-native architectures, having a single, correlated view of system health becomes essential. This holistic approach breaks down data silos and gives engineering teams the complete picture they need to understand how everything connects.
Ultimately, the goal is to make observability more proactive and less reactive. The emphasis is shifting toward gaining real-time insights that empower teams to solve problems as they happen, not after a customer files a complaint. By combining comprehensive data collection with intelligent analysis, the next generation of observability tools will help you build more resilient, performant, and reliable software.
Related Articles
- Observability, Powered by Cake
- AI Infrastructure: A Primer
- The Future of AI Ops: Exploring the Cake Platform Architecture?
- Why Observability is Critical to Modern AI Workflows
- Best Open-Source Tools for Observability
Frequently asked questions
Isn't observability just a new name for monitoring?
That's a fair question, and it's easy to see why people think that. The simplest way to see the difference is to think of monitoring as watching for problems you already know can happen, like a server running out of memory. Observability is about having a system so transparent that you can figure out problems you never could have predicted. Monitoring tells you that something is wrong, while observability helps you ask questions to understand why it's wrong.
Do I really need all three pillars, or can I just get by with logs?
While logs are incredibly useful, relying on them alone is like trying to solve a puzzle with only a third of the pieces. Logs give you the detailed "what happened," but they often lack the broader context. Metrics can alert you that a problem exists, and traces can show you exactly where in your system the problem occurred. Using them together is what allows you to connect the dots quickly and move from a vague issue to a specific root cause without getting lost in the details.
This sounds great, but where do I even begin with implementing it?
Starting with observability doesn't have to be overwhelming. The best first step is to define a clear goal that's tied to a business outcome, like improving a specific slow feature for your users. From there, you can choose a tool or platform that helps you gather the data you need to understand that one area. Focus on instrumenting the most critical parts of your application first. Think of it as an ongoing practice of improvement, not a massive, one-time project.
Is observability only useful for troubleshooting when things are already broken?
Not at all. While it's a lifesaver for fixing issues, one of its biggest benefits is making good systems even better. The data you collect can shine a light on hidden inefficiencies or performance bottlenecks you didn't even know existed. By proactively finding and optimizing these small issues, you can make your application faster and more reliable. This leads to a much better experience for your users and can even lower your operational costs over time.
How is observability specifically important for AI and machine learning systems?
AI systems introduce unique layers of complexity beyond typical software. You're managing data pipelines, model behavior, and prediction performance, not just application code. Observability gives you the visibility to understand this entire lifecycle. It helps you answer critical questions like, "Is a change in data quality affecting my model's accuracy?" or "Which part of my inference pipeline is causing latency?" For AI applications, it's essential for ensuring your models are not just intelligent, but also stable and dependable in a production environment.
About Author

Cake Team
More articles from Cake Team
Related Post
Beginner's Guide to Observability: Metrics, Logs, & Traces

Cake Team
Top Open Source Observability Tools: Your Guide

Cake Team
AIOps vs Observability: Why You Need Both for AI

Cake Team
Open Source Medical AI: A Beginner's Guide

Cake Team
