


.png?width=220&height=168&name=Group%2010%20(1).png)


THE CAKE DIFFERENCE
![]()
Observability built for AI,
not just infrastructure
Traditional logging & monitoring
Fine for infra, blind to AI behavior: Legacy tools like Datadog, Splunk, or CloudWatch can track system health, but not model performance.
- Focused on infra (CPU, latency, error rates), not model output
- No visibility into prompts, retrievals, or model responses
- Hard to debug LLM failures or hallucinations
- No context on user queries or model decision paths
The Cake approach
Purpose-built visibility into every layer of your AI stack: Track prompts, responses, retrievals, costs, evals, and more in real time.
- Trace every request across agents, tools, and model calls
- View full prompt/response pairs, retrieval sources, and ranking logic
- Built-in evals for quality, latency, and cost across agents
- Connect logs to user behavior and business outcomes
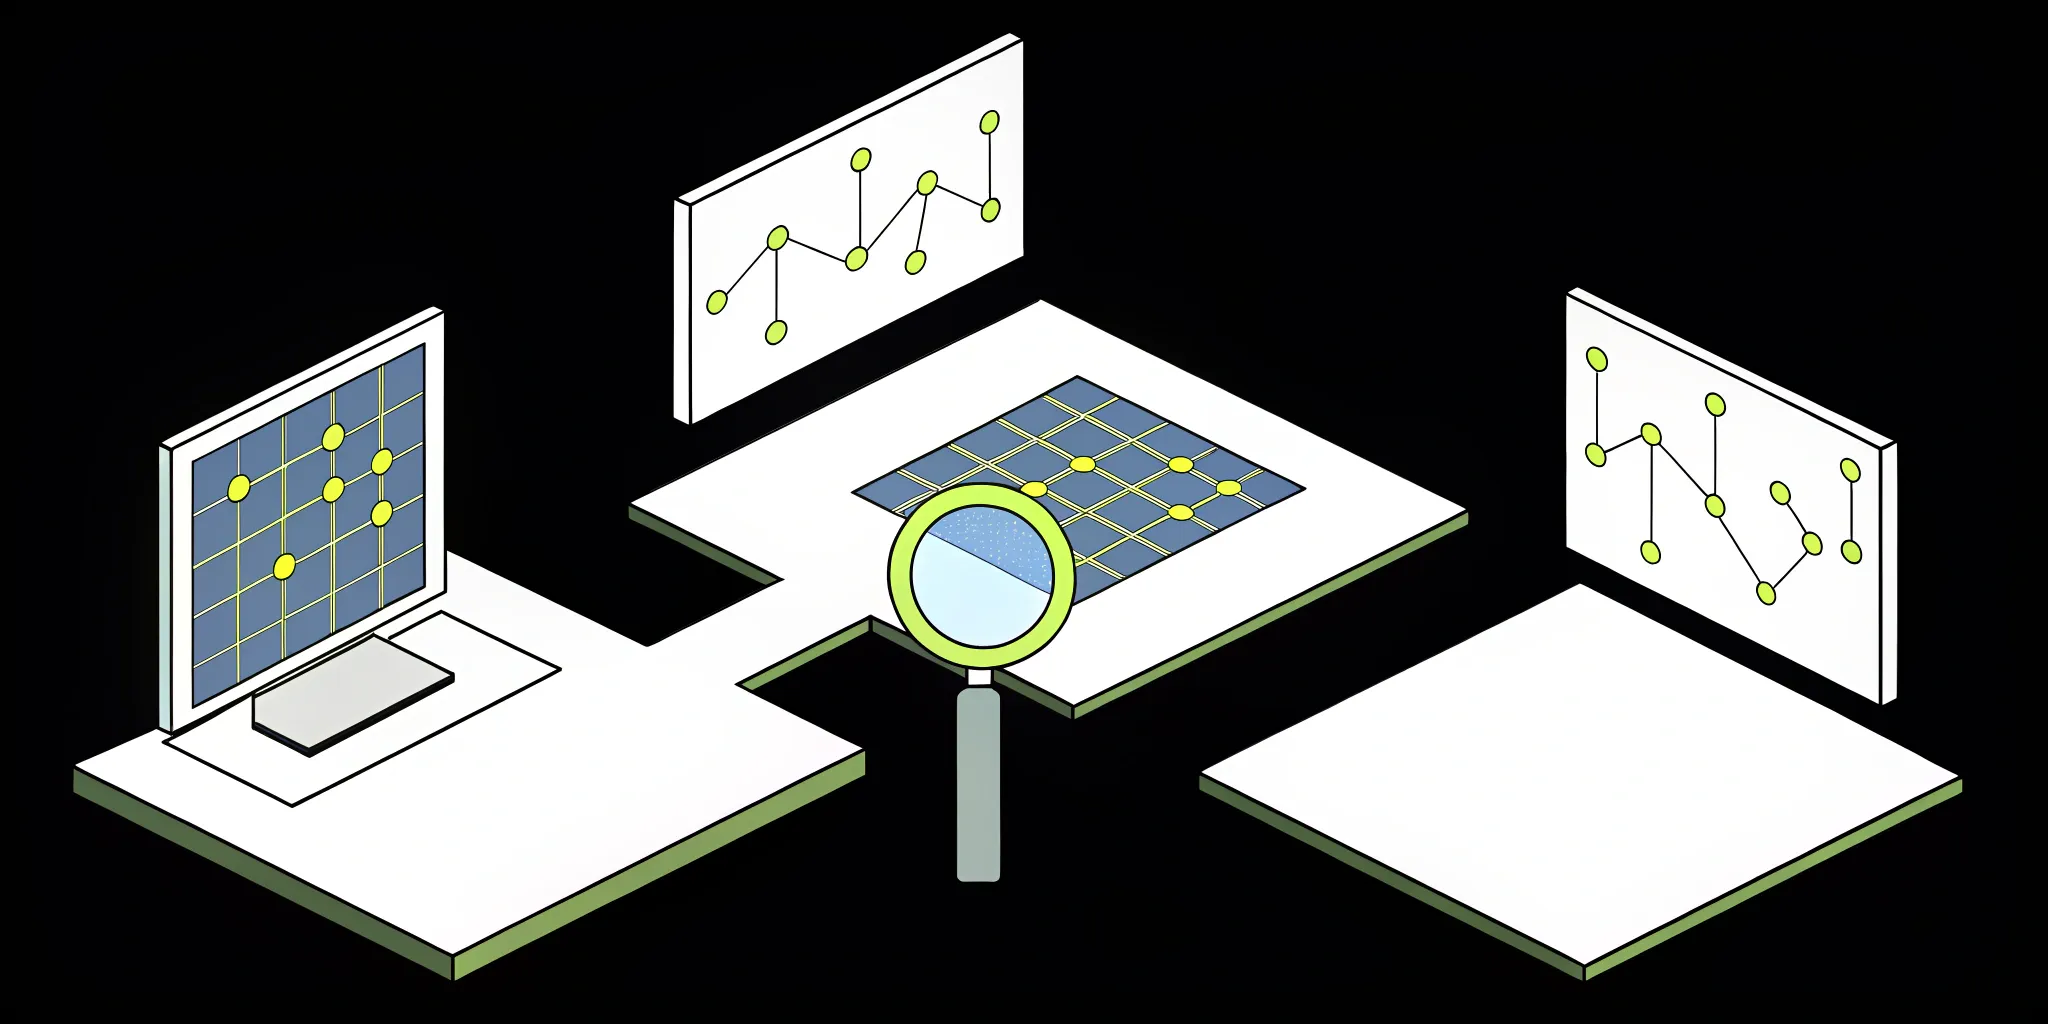
EXAMPLE USE CASES
![]()
Put observability to work
across your stack

Monitor LLM performance in real time
Track response latency, token usage, and context window issues across inference calls to spot degradation before users notice.

Catch pipeline failures before they cascade
Trace bottlenecks across ingestion, transformation, and model serving to prevent data freshness issues and silent errors.

Detect agent drift and context loss
Surface when agent behaviors change unexpectedly or start returning low-confidence responses, with full visibility into upstream signals.

Debug GPU utilization and scaling issues
Correlate workload performance with GPU usage, autoscaling events, and memory constraints to fine-tune system behavior.

Enable secure, auditable observability in regulated environments
Keep all observability data in your own VPC with full control over access, retention, and redaction.

Accelerate root cause analysis across hybrid infrastructure
Unify logs, traces, and metrics from cloud, on-prem, and edge environments to reduce MTTR and eliminate guesswork.


Scott Stafford
Chief Enterprise Architect at Ping
CEO
InsureTech Company
Felix Baldauf-Lenschen
CEO and Founder
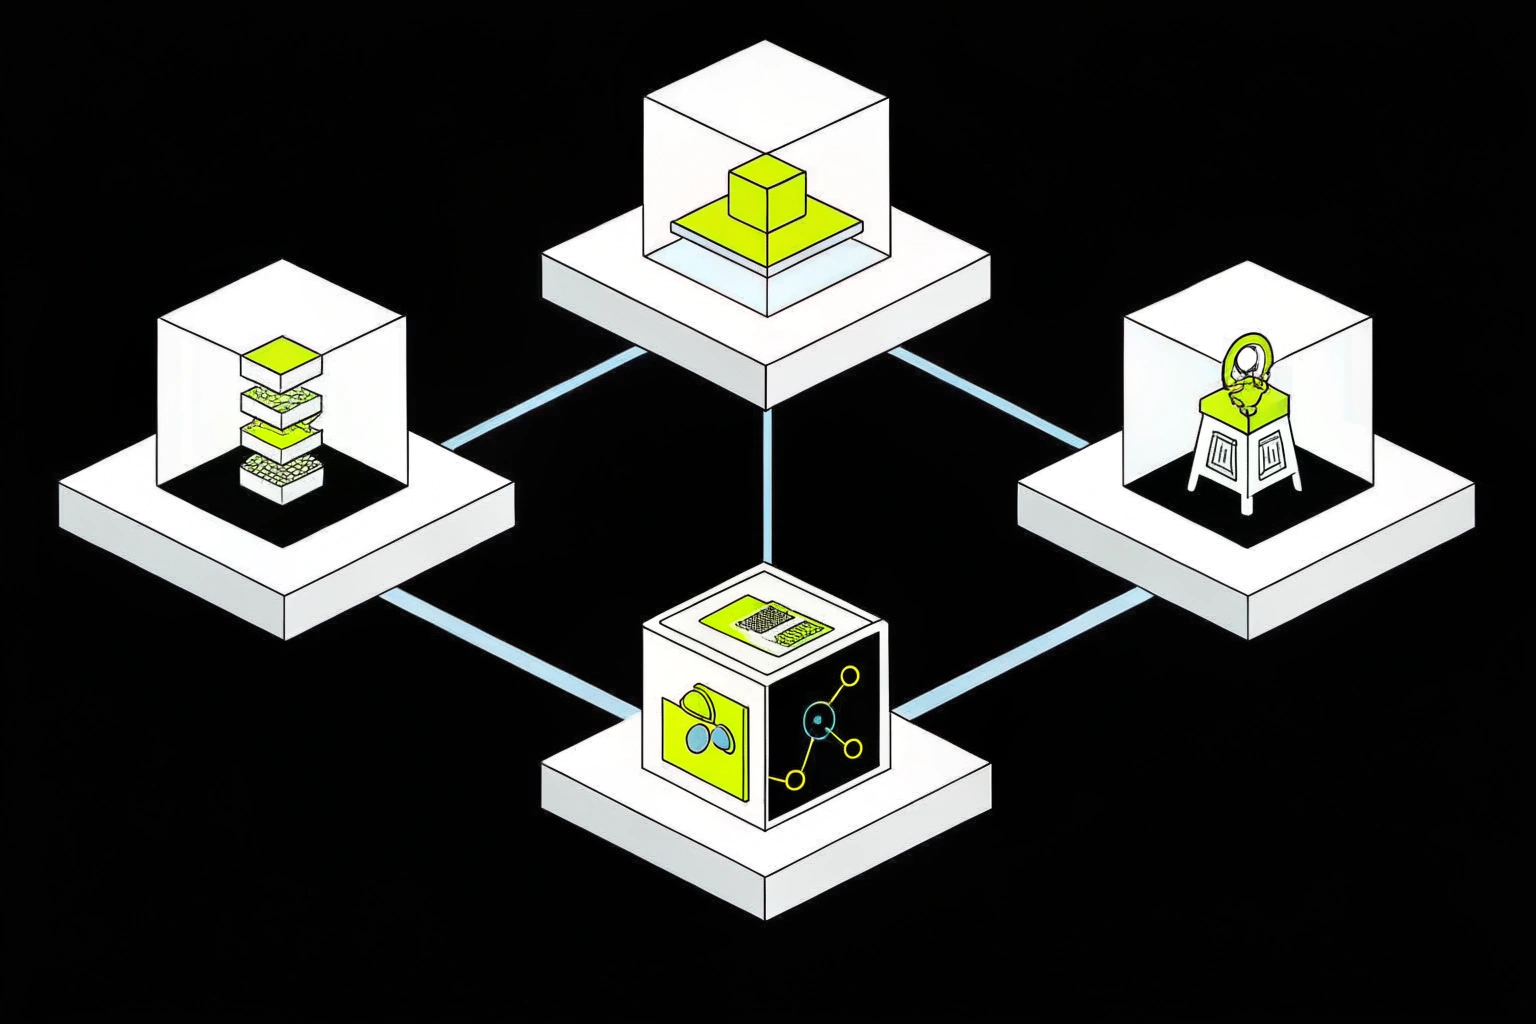
COMPONENTS
![]()
Tools powering Cake's
observability stack

Deepchecks
Automate data validation and monitor ML pipeline quality with Deepchecks, fully managed and integrated by Cake.

Evidently
Evidently is an open-source tool for monitoring machine learning models in production. Cake operationalizes Evidently to automate drift detection, performance monitoring, and reporting within AI workflows.

Grafana
Grafana is an open-source analytics and monitoring platform used for observability and dashboarding. Cake integrates Grafana into AI pipelines to visualize model performance, infrastructure metrics, and system health.

NannyML
NannyML is an open-source library for monitoring post-deployment data and model performance. Cake integrates NannyML to automate AI drift detection, quality monitoring, and compliance reporting.

Prometheus
Prometheus is an open-source systems monitoring and alerting toolkit. Cake integrates Prometheus into AI pipelines for real-time monitoring, metric collection, and governance of AI infrastructure.

Langfuse
Langfuse is an open-source observability and analytics platform for LLM apps, capturing traces, user feedback, and performance metrics.

OpenTelemetry
OpenTelemetry provides standardized tools for tracing, metrics, and logging in distributed systems. It enables deep visibility into applications, services, and infrastructure.

OpenNMS
OpenNMS provides comprehensive fault, performance, and topology monitoring for networks of all sizes. It supports SNMP, flow data, and custom integrations.
Top Open Source Observability Tools: Your Guide
Building and maintaining modern software, particularly for AI initiatives, can feel like you're constantly reacting to problems. An alert fires, and...

Beginner's Guide to Observability: Metrics, Logs, & Traces
Building powerful AI is one thing; keeping it running smoothly is another challenge entirely. Your team's success depends on having systems that are...

What Is Observability? A Complete Guide
At its core, understanding observability is about being able to ask any question about your software’s internal state and get a clear, data-backed...